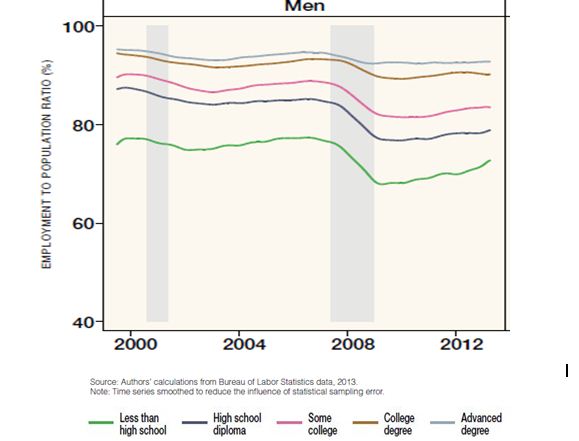
Prime Age Employment # Line Graph

The graph shows the percentage of men with different degrees, involved in prime age employment, in Unite d States, over a period of, 2000 to 2012.
Summarize the information by selecting and reporting the main features and make comparisons where relevant.
Write at least 150 words.

Prime Age Employment

Prime Age Employment


The graph indicates what percent of men, in United States, attained prime age employment, having different educational qualifications; less than high school, high school diploma, some college, college degree or advanced degree.

Between 2000 and 2012 percentage of men doing prime age employment, changed to some extent, in all five categories, but the most marked change was in men having high school diploma or some college degree. At the beginning of the period the proportion of such men employed in prime age was slightly lower than the ones with college or advanced degree. However, by 2012 this figure had
declined to nearly 80 percent.

The other category wherein the percentage of employment fell over the period was ,less than high school. However, the changes here were much less dramatic. Proportion of men involved in prime age employment remained nearly steady till 2008 when it dipped by few percent; observing a significant increase after 2008.

In two categories, college and advanced degree, the proportion of men employed remained steady, indicating a slight decline during 2008, after which it remained nearly constant. Thus, by the end of period, the highest proportion of men in prime age employment had advanced degree, and the lowest proportion had less than high school.

In conclusion, the graph shows that the patterns of employment in United States changed to some extent over the period of 2002 to 2012, the ones with high school diploma or some college showing the most marked change.
IELTSBAND7

Don’t Be A Waste Of Space # Idioms For IELTS

If you have got the life, try hard to not be a waste of space. Go on, read more and learn some of the most interesting idioms.

WASTE OF SPACE
SENTENCE-: sometimes the people we consider waste of space are the ones who are the most talented.
MEANING-: someone perceived as useless or incompetent.
WATCH THE TIME
SENTENCE-: watch the time while playing, you surely don’t want to be late, right?
MEANING-: ensure that you are aware of the time
WATCH THE WORLD GO BY
SENTENCE-: stop watching the world go by and start doing something for yourself.
MEANING-: spend time observing other people going about their business
WATCH YOUR BACK
SENTENCE-: Watch your back, you are now the candidate of A party.
MEANING-: protect yourself against danger, usually from someone unexpected off.
THE WATCHES OF NIGHT
SENTENCE-: The watches of night have become quite disastrous for me these days, because of the murder I saw that day.
MEANING-: the time of the night when you cannot sleep.
LIKE WATER
SENTENCE-: Indian people spend money in marriages like water.
MEANING-: in great quantities
OF THE FIRST WATER
SENTENCE-: Milkha Singh is of the first water.
MEANING-: extreme or unsurpassed kind
WATER UNDER THE BRIDGE
SENTENCE-: Stop focusing on the water under the bridge, there are other matters that need your attention.
MEANING-: used to refer to situations or events that happened in past and are no longer of any importance.
MAKE WAVES
SENTENCE-: Narendra Modi has surely made waves in the past one year.
MEANING-: create a significant impression
WAX AND WANE
SENTENCE-: The economic condition of our country has undergone many wax and wanes before settling to something this constant.
MEANING-: undergo alternate ups and downs

Wondering why should you learn idioms? CLICK HERE
IELTSBAND7

Exercise # Punctuation Marks

Exercise # Punctuation Marks

Given below are sentences with no punctuation marks. Punctuate them properly, using different punctuation marks.

  1. Alexander the conqueror of the world began to weep.
  2. We should be devout and humble cheerful and serene.
  3. Ali received a watch Avinash a book
  4. Men may come and men may go but I go on forever.
  5. Exactly so said Anmol.
  6. If my husband were alive but why lament past
  7. The lord he is the god
  8. Add two 4s and three 5s.
  9. Her court was pure her life serene
  10. The three great books are the Ramayana the Mahabharata and the Gita.
  11. O father I heard the sound of a revolver


ANSWERS

  1. Alexander, the conqueror of the world, began to weep.
  2. We should be devout and humble, cheerful and serene.
  3. Ali received a watch; Avinash, a book.
  4. Men may come, and men may go, but I go on forever.
  5. “Exactly so”, said Anmol.
  6. If my husband were alive– but why lament past?
  7. The Lord, He is the God.
  8. Add two 4’s and three 5’s.
  9. Her court was pure; her life serene;
  10. The three great books are :the Ramayana, the Mahabharata and the Gita.
  11. O father! I heard the sound of a revolver.

IELTSBAND7

Percentage Of Poverty-2 # Bar Graph

You should spend about 20 minutes on this task.
The graph below shows the percentage of households, grouped by poverty, on the basis of access to refrigerator, electricity and water in Ghana for the year 1991/1992 to 1998/1999.
Summarize the information by selecting and reporting the main features and make comparisons where relevant.
Write at least 150 words.

Percentage Of Poverty

Bar Graph

The graph illustrates the level of poverty amongst households in Ghana over a period of seven years i.e. from 1991/92 to 1998/99, grouped according to the access of refrigerator, electricity and water.
The financial condition of households accessing water marked an increase from 1991/92 to 1998/99. On one hand, the percentage of houses categorized as very poor and non-poor saw a gradual increase of 2% and 4% respectively whereas the number of households having the facility of water ,living in poor conditions remained constant.
However, the effect of electricity over the monetary status of households observed a steep decline of 14% and 9% respectively, in the ones classified as very poor and poor; while the percentage increased from 73% to 85% in case of non-poor households.
In contrast, the percent of very poor households having access to refrigerator remained constant at 3%. On the other hand, the proportion of poor households having refrigerator declined from 11% to 7% and saw an increase of 13% with respect to non-poor households.
Overall, most of the houses irrespective of their financial conditions had access to water and electricity, while refrigerator remained to be of less priority amongst most of the households.

 
IELTSBAND7

1 13 14 15 16 17 24