Bakery Sales # Graphs For IELTS

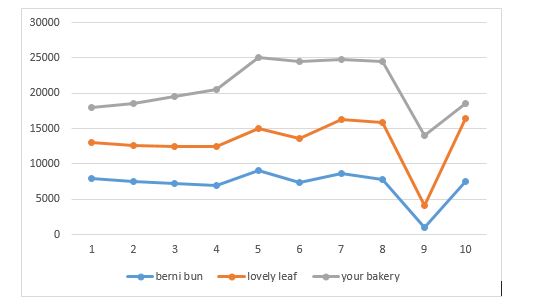
The graph shows data about the annual sales of three factories in London, 2001-2010.

Summarise the information by selecting and reporting the main features, make comparisons where relevant.

Bakery Sales

Bakery Sales

The graph illustrates the number of products sold by three factories (Berni Bun, Lovely Leaf and Your Bakery) over the period of nine years i.e. from 2001 to 2010. Units are measured in euros.

Overall, the factories showed an increase during the year 2004 while the sales dipped down in 2009. Your bakery remained the highest selling bakery over the entire period while berni bun sold the least number of bakery items.

For the initial years, from 2001 to 2004, your bakery marked a steady growth while Berni bun and lovely leaf dipped down, marking a slight difference in their sale. However, an increase of approximately 5000, 3000 and 2000 was observed in the sales of your bakery, lovely leaf and berni bun respectively from 2004-2005.

During 2005-2008, the sales in your bakery remained steady while fluctuations were observed in lovely leaf and berni bun. The sales then slumped for all the three factories in 2008-2009, marking an upward trend from 2009-2010.

Number Of People Injured/Dead # Graph For IELTS

The graph below shows the number of people injured/dead in various types of riots in India for the year 2014.

Summarise the information by selecting and reporting the main features, make comparisons where relevant.

Injured/Deaths

Injured/Deaths

Source: National Crime Record Bureau

SAMPLE ANSWER

The graph illustrates the number of injuries or deaths caused in India during the different kinds of riots (student, agrarian, caste, political and communal) in 2014.

According to the data, the maximum number of deaths/injuries were reported during political riots followed by communal and caste riots while student riots marked the least number of fatal incidents.

Reporting of approximately 2500 deaths/injuries was done during political riots with communal riots disturbing nearly 2000 lives. Deaths/injuries during caste riots were less than those during former yet the figures were dramatic, stating approximately 1800 deaths/injuries.

Although, the agrarian and student riots caused the least number of deaths, agrarian riots left approximately 1100 dead/injured while nearly 600 were found either dead or critically injured during student riots.

IELTSBAND7

phone icon

IELTS Dehradun Uttarakhand Tel: 8439000086 , 8439000087


How To Express Opinion Ideas

Often times when taking your IELTS, you will be asked to give your opinion. When you give your opinion it is very important to start by saying what is good about the opposite opinion. If I love books, instead of saying I love books.

Although some people prefer watching videos, I prefer reading books.

We can practice now.

Ques – What do you prefer, travelling alone or with friends?

Possible answer – Although some people prefer travelling with friends, I enjoy travelling the most when I am alone.

Although is used to show contrast. It is a good idea to use it when writing essays or speaking.

Even though is a similar word.

Ques- Would you rather go to desert or beach

Possible answer – Even though deserts have their own fun, I love beaches.

Understanding ALTHOUGH and EVEN THOUGH


 Although/Even though subject he/she  verb  ,  subject verb

Even though India is a good country, India has issues.

Subject can be anything, he/she/we/noun.

Verb – is is a verb

After this, you need to put a comma.

Remember, when using although/even though there are two parts of the sentence. The one before comma and the other after it.

Some more words –

Despite _______, I prefer ______.

Example- Despite the advantages of high earning job, I prefer doing a work that makes me happy.

Despite is followed by noun only.

________; nevertheless, ________.

Example -Some people like living alone; nevertheless, I like living with my family.

__________;however, ________.

Example- Some people like travelling; however, he likes living at his house.

IELTSBAND7

Deaths In Venus # Graph For IELTS

The graph below shows the number of deaths in Venus during the year 1029-1031.

Summarise the information by selecting and reporting the main features, make comparisons where relevant.

Deaths In Venus

Deaths In Venus

The chart illustrates the number of deaths caused by six diseases ( Aids, leprosy, tropical disease, diarrhoea, malaria and TB) in Venus over a period of 2 years from 1029-1031.

Overall, Aids, diarrhoea and TB remained the dominant diseases, causing the highest number of deaths while malaria was held responsible for the least number of deaths. The number of deaths caused by Leprosy were higher than malaria, however were not as dramatically high as that of the dominant diseases.

Over the period of two years, Aids and TB had taken a turmoil on the lives of individuals of Venus causing almost the same number of deaths. Around 50000 lives were lost because of the two deadly diseases with deaths caused by TB being only slightly less than the former.

The number of individuals dying because of  malaria and leprosy were comparatively low causing approximately 10000 deaths.