
Number Of People Injured/Dead # Graph For IELTS
The graph below shows the number of people injured/dead in various types of riots in India for the year 2014.
Summarise the information by selecting and reporting the main features, make comparisons where relevant.
Injured/Deaths
Source: National Crime Record Bureau
SAMPLE ANSWER
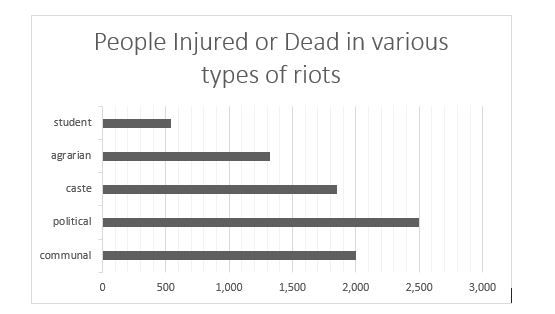
The graph illustrates the number of injuries or deaths caused in India during the different kinds of riots (student, agrarian, caste, political and communal) in 2014.
According to the data, the maximum number of deaths/injuries were reported during political riots followed by communal and caste riots while student riots marked the least number of fatal incidents.
Reporting of approximately 2500 deaths/injuries was done during political riots with communal riots disturbing nearly 2000 lives. Deaths/injuries during caste riots were less than those during former yet the figures were dramatic, stating approximately 1800 deaths/injuries.
Although, the agrarian and student riots caused the least number of deaths, agrarian riots left approximately 1100 dead/injured while nearly 600 were found either dead or critically injured during student riots.
![]()
IELTS Dehradun Uttarakhand Tel: 8439000086 , 8439000087