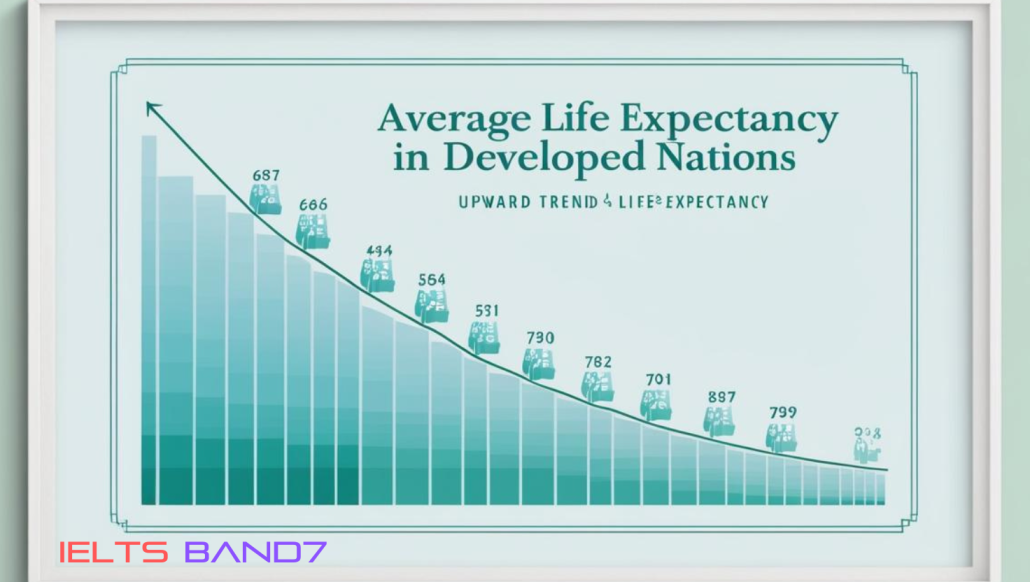
In the developed world, average life expectancy is increasing.
Academic Writing Task-1
Question: In the developed world, average life expectancy is increasing.
What problems will this cause for individuals and society? Suggest some measures that could be taken to reduce the impact of ageing populations.
Sample Answer:
Owing to sophistication in technology and rapid advancements made in medical sciences, in this day and age, the average life expectancy is elevating in the industrialized nations. However, this phenomenon is tend to create a detrimental impact on mankind and community. In this essay, I will delve into the same and also propose some viable solutions to alleviate the drawbacks comes with surging aged populace.
Substantially, in terms of individual plights, the most prominent one would be enormous financial burden and mental pressure. To explain this, the body of golden agers is normally frail and fragile which, in turn, makes them incapable or incompetent to perform household chores or run errands on their own. Consequently, demanding more attention and care from their offsprings and for this reason, usually housewives have to sacrifice their life staying at home taking care of their medicines and meals; resultantly, bringing mental pressure to them, and further to deal with it, if hiring house help , again it will be a financial strain on a breadwinner of a family. To top it off, this age is more prone or vulnerable to fatal ailments such as diabetes and cardiac problems which tend to consume a substantial proportion of a family’s income. Hence, this trend could result in wastage of manpower and money.
Moving further, as far as effect on society is concerned, primarily, as the retired people soar, it not only dwindles the workforce in the labour professions but also elevates pension responsibilities. This will certainly going to be a disturbing factor in the economic level of a country since shrinking workforce means less tax revenue, eventually disrupting the budget of other significant domains. Additionally, being the responsible government, investments have to be made in healthcare department by building more hospitals to ensure the well-being of their citizens. As a result, putting immense pressure on the administration.
Turning to the pragmatic solutions which could be implemented to combat this issue. The pivotal among them is revision of pension policy. To be precise, normally the retirement age is 60, increasing it to 65 or 70 would make a big difference considering in mind that they are fit. Another way to address this plight would be persuading them to lead a more productive and healthy lifestyle by either eating a balanced diet or indulging in exercises such as mindfulness meditation, gardening or a regular walk. This will make them less dependent on their children.
In conclusion, ageing populations can have some notable implications on government and and individual lifestyles such as financial pressures and instability in economy; however, this can be addressed by adopting above mentioned methods.
Feel free to call for suggestions and queries.
![]()
67Near Ballupur Chowk, Dehradun
email: info at ieltsband7.com
email: info@ieltsband7.com