IELTS Graph # temperatures in three cities
WRITING TASK 1
You should spend about 20 minutes on this task.
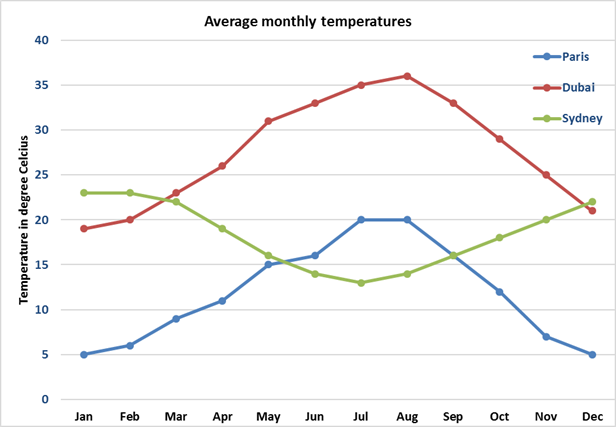
The line graph below shows the average monthly temperatures in three major cities.
Summarise the information by selecting and reporting the main features, and make comparisons where relevant.
Write at least 150 words.
IELTS WRITING TASK 1 Graph
Sample Answer:
The line graph provides information about how the mean monthly temperatures vary in Paris, Dubai and Sydney over the course of a year.
One striking feature of the graph is that Paris experiences its lowest temperatures in December/January. In the following six months, the mercury rises gradually and hits its peak at 20°C in July/August. From September onwards, the figures drop steadily before reaching their minimum value of around 5°C in December/January. Interestingly, the temperature patterns for Dubai are similar to Paris, although it has warmer winters and hotter summers. The lowest and highest temperatures in Dubai are around 20°C and 36°C respectively.
On the other hand, the temperature variations in Sydney are opposite to that observed in Paris and Dubai. Sydney has its hottest weather in December/January when the mercury hovers around 23°C. In the next six months, there is a gradual decline in the mercury levels which reach their lowest level of nearly 13°C in July. Thereafter, the temperature follows an upward trend until December.
Overall, the mean monthly temperatures are the highest in Dubai and are the lowest in Paris. In comparison, Sydney has moderate mercury levels throughout the year.
Feel free to call for suggestions and queries.
![]()
IELTS Band 7 Dehradun
Near Ballupur Chowk, Dehradun
email: info at ieltsband7.com