Writing task 1

Writing task 1

Writing task 1: single line graph

You will be given a graph with a single line. Your task is to write a 150 word report to describe the information given in the graph. You are not asked to give your opinion. You should spend around twenty minutes on the task. Task one is not worth as many marks as task two and so you should make sure that you keep within the recommended twenty minute time frame.
What is being tested is your ability to:

• objectively describe the information given to you
• report on a topic without the use of opinion
• use suitable language to describe the graph


Feel free to call for suggestions and queries.

phone icon

8439000086

8439000087

7055710003

7055710004

IELTS Band 7 Dehradun
Near Ballupur Chowk, Dehradun

email: info at ieltsband7.com

IELTS online simulator

IELTS BAND 7 Home page

Writing task one : tables

Writing task one: tables

Writing task one : tables

You will be given one table of figures. Your task is to describe the information given in the graph by writing a 150 word report. You are not asked to give your opinion. You should spend around 20 minutes on the task.

What is being tested is your ability to:

• objectively describe the information presented in a table
• compare and contrast
• report on an impersonal topic without the use of opinion
• use language appropriate to the description of tables


Feel free to call for suggestions and queries.

phone icon

8439000086

8439000087

7055710003

7055710004

IELTS Band 7 Dehradun
Near Ballupur Chowk, Dehradun

email: info at ieltsband7.com

IELTS online simulator

IELTS BAND 7 Home page

IELTS Graphs Sample Answer # Animal Population

IELTS Writing Task

You should spend 20 minutes on this task.

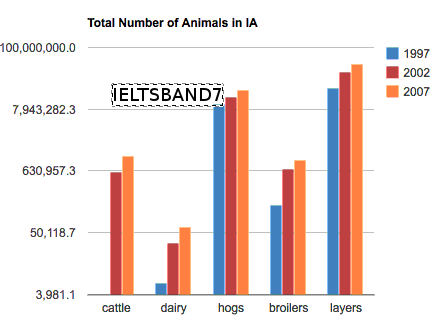
The graph illustrates the animal population present in IA over the period of 10 years. 

Write a report explaining the graph. You should write at least 150 words.

ANIMAL POPULATION IN IA

animal population


SAMPLE ANSWER

The graph illustrates the number of animals, cattle, dairy, hogs, broilers and layers present in IA from 1997 to 2007.

In the  year 1997, layers were the highest number of animals present followed by hogs. Broilers were present half in number when compared to hogs and layers whereas cattle were not present at all. However, by the year 2002, the population of cattle boomed surpassing the dairy animals and was approximately equal to the number of broilers. Around 7 millions hogs and broilers were present in 2002, while less than five million dairy animals existed.

Towards 2007, the population of all animals increased only with a minimal percentage, with hogs and layers being the maximum animals present in IA. The number of cattle and broilers remained approximately equal while dairy animals were the least present.

Overall, layers were the highest number of animals present in IA whereas while cattle were the least present initially, dairy animals were found minimal in IA over the decade from 1997 to 2007.


Feel free to call for suggestions and queries.

phone icon

8439000086

8439000087

7055710003

7055710004

IELTS Band 7 Dehradun
Near Ballupur Chowk, Dehradun

email: info at ieltsband7.com

IELTS online simulator

IELTS BAND 7 Home page

IELTS WRITING TASK 1 Graph # Leisure activities by males and females in the USA

IELTS WRITING TASK 1 Graph # Leisure activities by males and females in the USA

You should spend about 20 minutes on this task.
The bar chart below provides information about the time spent in leisure activities by males and females in the USA in 2014.
Summarise the information by selecting and reporting the main features, and make comparisons where relevant.
Write at least 150 words.

leisure activities by males and females in the USA

leisure activities by males and females in the USA

Sample Answer:

The bar graph compares the amount of time men and women expended every day in different leisure and sports activities in America in 2014.
One striking feature of the chart is that watching TV was the favorite free time activity for both the genders. On average, males spent 3 hours daily in front of their TV sets while women spent 2.6 hours. Socializing and interacting with family and friends was the next most preferred form of recreation. Both men and women spent 0.7 hours per day on this activity.
Leisure activities, sports, exercise and using electronic devices like computers were more popular among males. On the other hand, the opposite was true for reading as females expended 0.4 hours daily on this activity whereas men spent merely 0.3 hours. Interestingly, thinking or relaxing were equally popular among both sexes. This form of entertainment accounted for 0.3 hours daily for both men and women.
Overall, there were minor differences in the amounts of times males and females spent in different leisure and sport activities but watching TV was the activity which occupied the most time. (184 Words.)


Feel free to call for suggestions and queries.

phone icon

8439000086

8439000087

7055710003

7055710004

IELTS Band 7 Dehradun
Near Ballupur Chowk, Dehradun

email: info at ieltsband7.com

IELTS online simulator

IELTS BAND 7 Home page

1 2 3 4 5 6 10