
Percentage Of Poverty-2 # Bar Graph
You should spend about 20 minutes on this task.
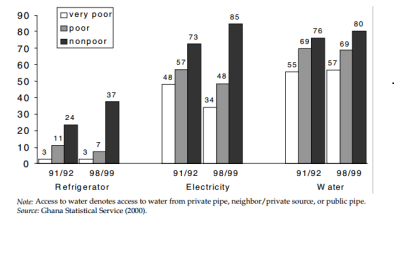
The graph below shows the percentage of households, grouped by poverty, on the basis of access to refrigerator, electricity and water in Ghana for the year 1991/1992 to 1998/1999.
Summarize the information by selecting and reporting the main features and make comparisons where relevant.
Write at least 150 words.
Bar Graph
The graph illustrates the level of poverty amongst households in Ghana over a period of seven years i.e. from 1991/92 to 1998/99, grouped according to the access of refrigerator, electricity and water.
The financial condition of households accessing water marked an increase from 1991/92 to 1998/99. On one hand, the percentage of houses categorized as very poor and non-poor saw a gradual increase of 2% and 4% respectively whereas the number of households having the facility of water ,living in poor conditions remained constant.
However, the effect of electricity over the monetary status of households observed a steep decline of 14% and 9% respectively, in the ones classified as very poor and poor; while the percentage increased from 73% to 85% in case of non-poor households.
In contrast, the percent of very poor households having access to refrigerator remained constant at 3%. On the other hand, the proportion of poor households having refrigerator declined from 11% to 7% and saw an increase of 13% with respect to non-poor households.
Overall, most of the houses irrespective of their financial conditions had access to water and electricity, while refrigerator remained to be of less priority amongst most of the households.