
IELTS WRITING TASK 1 Graph #Canadian College
IELTS WRITING TASK 1
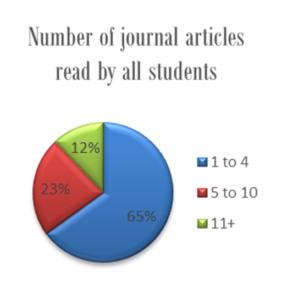
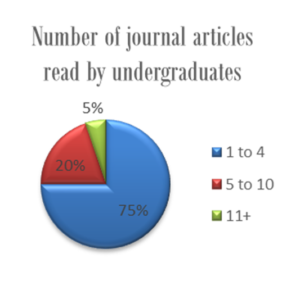
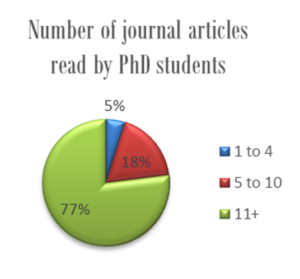
You should spend about 20 minutes on this task.The given pie charts provide information about the number of journal articles read per week by all students, undergraduates, and PhD students at a Canadian College in 2015.Summarise the information by selecting and reporting the main features, and make comparisons where relevant.Write at least 150 words.
 |
 |
 |
Sample Answer
The pie charts show how many articles from academic journals were read weekly by undergraduates and PhD students compared to other students at a Canadian College in the year 2015.
Looking at the details, a sizeable majority (75%) of undergraduate students read 1-4 articles per week. In comparison, the average for the entire student body in this category was slightly lower, 65 per cent. Furthermore, 20% first degree seekers read between 5 and 10 articles a week. The percentage of average students in this reading group was 3% higher. For the third category, fewer undergraduates read over 11 articles compared with the average student. The figures were 5 per cent and 12 per cent respectively.
Meanwhile, for PhD students the pattern was substantially different. Most read 5 or more articles per week (95%) and out of this total 77 per cent read at least 11 articles a week, which was almost fifteen times the corresponding figure for undergraduates. Notably, only 5% students researching for a PhD read 1-4 articles a week.
Overall, what stands out from the data is that the students who were studying doctorates read more articles per week than either undergraduates or other students.
(197 Words)
Thank you for providing such a beneficial matter…..