IELTS Writing Pie Chart Sample Answer # Population Growth
You should spend 20 minutes on this task.
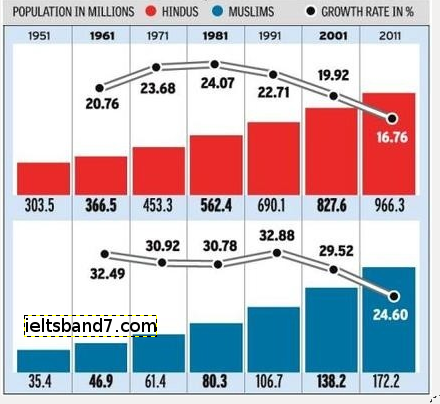
The graph below shows the increase in the population of Hindus and Muslims over a decade.
Write a report to a university lecturer giving analysis of the report.
You should write at least 150 words.
SAMPLE ANSWER
The line graph illustrates the growth rate of population of Hindus and Muslims over a period of 70 years from 1951 to 2011. Units are measured in percentage.
For the first three decades, i.e. till 1971 Hindus showed a linear increase in their population with the population growth showing an increasing from 20.76 to 24.07. On the other hand, the growth rate of Muslims marked a consistent decline, from 32.49 to 30.78.
From 1991 to 2001, the growth rate of Hindus and Muslims dipped down. Whereas on one hand, the Hindus population growth dropped down to an alarming 16.76 Muslims were still higher with a population growth rate of 24.60 percent in 2011.
Overall, the growth rate of Hindus was highest in year 1981 whereas Muslims marked the highest population increase in year 1961. Although, there were uncertainties in the population rate for Hindus and Muslims, Muslims had a higher growth rate as compared to Hindus.