
IELTS Graph # International money market
IELTS WRITING TASK 1 Graph
International money market
You should spend about 20 minutes on this task.
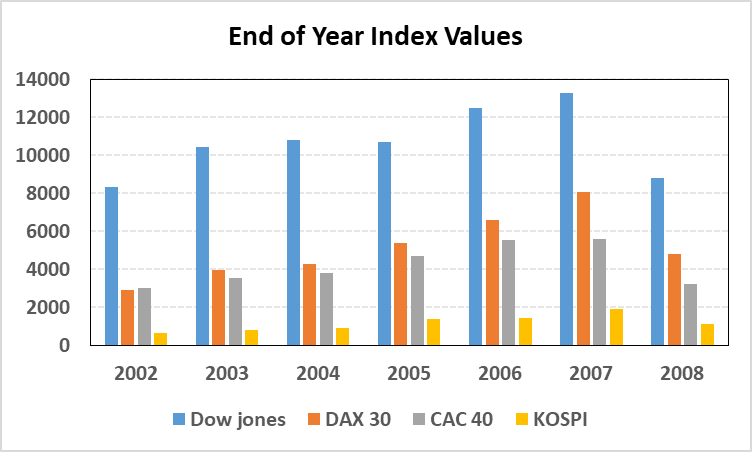
The chart shows the end of year value for four major international money market indices from 2002 to 2008. [Dow Jones = US Market Index, DAX 30 = German Market Index, CAC 40 = French Market Index, KOSPI = Korean Market Index]
Summarise the information by selecting and reporting the main features, and make comparisons where relevant.
Write at least 150 words.
Sample Answer
The bar chart provides information about the variation in the end of year values of four main international market indices over a period of eight years between 2002 and 2008.
Looking at the details, the American index was the strongest in each of the eight years. In comparison, the values of other three indices were considerably less than that of USA. Starting off at just over 8000 points in 2002, the US index reached its peak value of around 13000 points in 2007, before dropping off to its lowest level at nearly 9000 points in 2008.
The German market index was the second most valuable throughout the given period, peaking in 2007 at about 8000 points before witnessing a 3000 point drop in value by the end of 2008. There was a tight correlation in the value and performance of German and French markets. The value of French market index was less than that of the German index in each of the years except 2002. Even though the Korean market index had a similar performance trend, its value was the lowest.
Overall, what stands out from the data is that all four of the market indices rose steadily in value during 2002-2007, but there was a sharp drop in their values in 2008. Notably, Dow Jones, the American market index, was the highest valued index throughout the period in question whereas KOSPI, the Korean market index, was the lowest valued index.
![]()
IELTS Dehradun Uttarakhand Tel: 8439000086 , 8439000087