
Overweight Adults Population Graph
IELTS ACADEMIC WRITING TASK 1 # Overweight Adults Population Graph
You should spend about 20 minutes on this task.
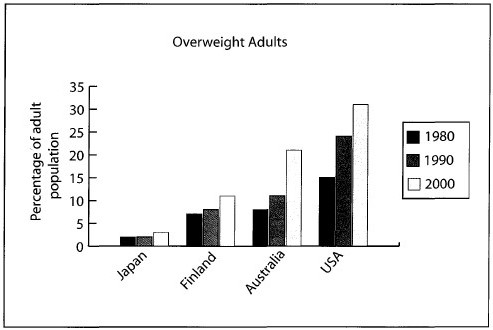
The chart below gives Information about the percentage of the adult population who were overweight in four different countries in 1980, 1990 and 2000.
Summarise the information by selecting and reporting the main features, and make comparisons where relevant.
Write at least 150 words.
overweight adults ielts Dehradun
The bar chart illustrates the variation in the proportion of obese adults in four different regions in 1980, 1990 and 2000.
One striking feature of the chart is that Japan had the lowest proportion of corpulent people in all three given years. Figures stood at about two percent in the 80s and 90s and rose by only one percent in 2000, indicating that the degree of change was the smallest in Japan.
Looking at Finland and Australia, around six percent Finnish and Australians were overweight in 1980. By the end of the period, the proportion of obese Finnish had almost doubled while that of Australians nearly tripled, reaching approximately 20%. This shows that the rate of increase in Australia was much higher than Finland.
Focusing on the distribution of overweight adults in America, it is clear that the USA had the highest percentage of obese people in each of the given years. The percentage rose from 15% in 1980 to a whopping 30% in 2000.
Overall, it can be concluded that the population of corpulent adults increased in all four countries, but the scale of problem and the rate of rise was greater in Australia and America.