Writing Task 1: Indian Retail Industry

Pie chart is a type of graph in which a circle is divided into sectors that each represent a proportion of the whole. These charts are best preferred when comparing different sub-categories or to represent the whole of the entire situation. This time let us have a look at a sample answer that compares two pie charts and summarizes the information required.

WRITING TASK 1

You should spend about 20 minutes on this task.

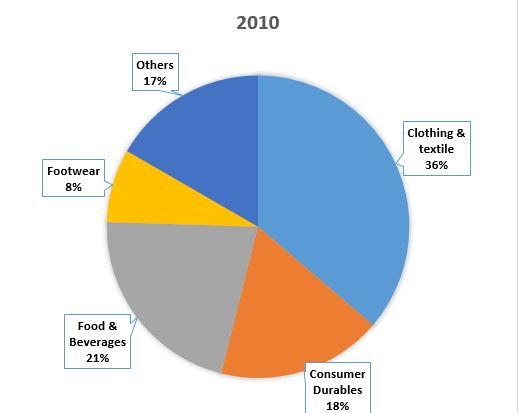
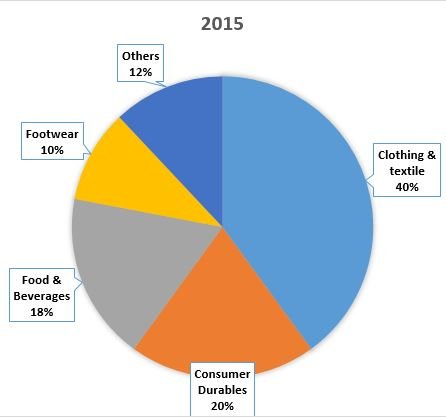
The pie charts below show the distribution of the market share of different segments in Indian Retail Industry from 2010 to 2015.

Summarise the information by selecting and reporting the main features, and make comparisons where relevant.
INDIAN RETAIL INDUSTRY

Best Coaching IELTS BAND 7 in Dehradun INDIAN RETAIL INDUSTRY

Sample Answer

The two pie charts compare the distribution of segments in the Indian retail sector during 2010 and 2015.

The significant segments for the retail sector in India were clothing and textile comprising  approximately 40% of the total market share. Whereas footwear and other sectors were the minor contributors in the Indian retail industry.

As we can see, clothing and textile consisted of 37% in the first year and showed an insignificant increase of only 3% in 2015. On the contrary, in 2010, the proportion of food and beverages fell marginally to 18% in 10 years.

With reference to the market share of the other two constituents of retail industry,there was an approximate 4% growth in consumer durable whereas, footwear segment rose by 2%  in 2015.On the other side, the market share of other segments declined by 5% in 2015,by 17%v to 12%.

(156 words)

phone icon

IELTS Dehradun Uttarakhand Tel: 8439000086 , 8439000087


IELTS Academic Writing task 1: In-house training

Writing Task 1:

You should spend about 20 minutes on this task.

The graph and pie chart below give information on in-house training courses in a large financial company.

Summarise the information by selecting and reporting the main features, and make comparisons where relevant.

Write at least 150 words.


Sample Answer

The charts provide details about various internal training programs in a financial organisation.

Overall, it can be clearly observed that the most amount of training hours per year are spent on technical skills. Most of the employees believe that training programs are important for their job.

Looking at the details of the pie chart, 30 hours per year are spent on training workers in technical field which is the highest in the given chart while a mere 5 hours per annum are invested on training employees in health and safety. Career development is the second most important topic as employees give 15 hours per year training to it whereas, 10 hours yearly are spent on training staff in interpersonal skills.

Office workers are subdivided into two categories: manager and secretary. Seventy seven percent managers and 86 % secretaries believe it is important for their job to participate in training.  Approximately 10 % of both the groups are of the view that training is a waste of valuable time. Nearly 2/3 of managers believe that participating in training is a good excuse for a change while the percentage of secretary is marginally lower. Half of the managers consider training as good for networking while fewer secretaries (41%) hold this opinion.

IELTS Dehradun Uttarakhand Tel: 8439000086 , 8439000087


IELTS WRITING TASK 1# Academic Staff Graph

IELTS WRITING TASK 1

You should spend about 20 minutes on this task.
The bar graph shows the percentage of male and female academic staff members in different faculties of a particular university in 2008.
Summarise the information by selecting and reporting the main features, and make comparisons where relevant.
Write at least 150 words.

Sample Answer

The bar graph provides information about the gender distribution of teachers in seven different departments of a university in 2008.
One striking feature of the chart is that there was a large gender disparity in some faculties. Engineering had the highest percentage of male academics whereas the faculty of history was dominated by female academics. Notably, there were approximately 90% male and 10% female teachers in the faculty of engineering. In history, nearly three quarters of the academic staff were women compared to approximately 30% men.

Other faculties, on the other hand, had a more balanced composition. In medicine, men and women were almost equally represented, while in arts slightly more than half of the teachers were female. Interestingly, astronomy and science were the only two faculties which had the same proportions of both the genders, 65% males versus 35% females. In law, the percentage of female academics was 5% higher than that in astronomy and science.

Overall, the chart shows that at this university, the faculties of engineering, astronomy and science were male-dominated; however, women had a significant presence in fields related to arts, history and medicine. (190 Words)


IELTS BAND 7

Contact us at –

IELTS Dehradun Uttarakhand Tel: 8439000086

IELTS WRITING TASK 1 Graph #Canadian College

IELTS WRITING TASK 1
You should spend about 20 minutes on this task.
The given pie charts provide information about the number of journal articles read per week by all students, undergraduates, and PhD students at a Canadian College in 2015.
Summarise the information by selecting and reporting the main features, and make comparisons where relevant.
Write at least 150 words.
IELTS Band7 College one IELTS Band7 College three IELTS Band7 College
Sample Answer
The pie charts show how many articles from academic journals were read weekly by undergraduates and PhD students compared to other students at a Canadian College in the year 2015.
Looking at the details, a sizeable majority (75%) of undergraduate students read 1-4 articles per week. In comparison, the average for the entire student body in this category was slightly lower, 65 per cent.  Furthermore, 20% first degree seekers read between 5 and 10 articles a week.  The percentage of average students in this reading group was 3% higher. For the third category, fewer undergraduates read over 11 articles compared with the average student. The figures were 5 per cent and 12 per cent respectively.
Meanwhile, for PhD students the pattern was substantially different. Most read 5 or more articles per week (95%) and out of this total 77 per cent read at least 11 articles a week, which was almost fifteen times the corresponding figure for undergraduates. Notably, only 5% students researching for a PhD read 1-4 articles a week.
Overall, what stands out from the data is that the students who were studying doctorates read more articles per week than either undergraduates or other students.
(197 Words)
IELTS BAND 7

Contact us at –

IELTS Dehradun Uttarakhand Tel: 8439000086

1 4 5 6 7 8 10